Cladistics
Cladistics is a technique for arranging classes or taxa into a set of hierarchical groups determined through the distribution of ancestral and derived character states across the taxa. The hierarchical arrangement is often described as a bifurcating one, or tree-like, and is a hypothesis about the ancestor-descendant relationships between taxa. The form of a particular cladistic tree is determined by the distribution of derived character states amongst taxa. Derived character states are those that have changed from earlier, ancestral forms. Cladistic analysis was developed in the context of determining biological evolutionary relationships, but the technique has recently seen much use in the study of cultural evolution where the taxa arranged may be artefact classes, languages, or human behaviour classes.
With large data sets of many taxa and character states, the computational requirements of cladistics are too much and computers must be used to sort through all the possible cladistic trees to arrive at the best hypothesis. There are many algorithms for this, with the maximum parsimony method widely used. Maximum parsimony analyses attempt to create the best evolutionary hypothesis by constructing a cladistic tree with the fewest evolutionary steps or transitions from ancestral to derived character states.
The use of cladistics in the study of cultural evolution is controversial for some. Critics argue that cladistic trees are too simple and that human similarities and differences cannot be explained by the bifurcation of human groups. While this critique may be valid for some uses of cladistics, when the technique is used to generate testable hypotheses for the distribution of cultural traits significant insights into cultural evolution can be gained.
Cladistics is a method for arranging classes where class similarities are homologous or a result of inheritance. The ultimate product of cladistic analysis is a phylogenetic tree. Phylogenetic trees arranges sets of classes, or taxa in cladistic terminology, each related through a hypothetical common ancestor. Phylogenetic trees are hierarchical so that at each level in the hierarchy more taxa are included in an ancestor-descendent relationship. There is a single fundamental difference between cladistics and other similarity measures that arrange taxa into hierarchical sets. In cladistics, all similarities, including all homologous similarities, are not equally used to characterize relationships between taxa. Taxa relationships are determined through the distribution of ancestral and derived character states across taxa. Character states, a term used in cladistics, are equivalent to components of class definitions. Both ancestral and derived character states represent homologies, but derived character states represent those character states that have changed or evolved from earlier, ancestral, character states. Thus taxa relationships that are based on derived character states will more accurately depict the recency of common origins across a set of phenomena.
Cladistic method can be used to arrange any set of phenomena that are related through transmission. The method was initially developed by Hennig (1950, 1966) as a response to perceived ambiguities in biological evolutionary classification and has since enjoyed considerable use. The application of cladistics to cultural phenomena has increased in recent years (e.g., Gray and Jordan 2000, Lipo et al. 2006, Mace and Pagel 1994, O’Brien, Darwent, and Lyman 2001, Tehrani and Collard 2002) and is the foundation for this encyclopedia entry. The following review of cladistics is based upon O’Brien and Lyman’s (2003) recent discussion of the method and its application to cultural phenomena as well as the abundant biological literature on cladistics from both a theoretical and practical standpoint (e.g., Forey et al. 1992, Kitching et al. 1998, Ridley 1986, Sober 1988).
Basics of Cladistic Analysis
Figure 1 is a simple phylogenetic tree arranging four taxa based on the distribution of character states in five dimensions. The cladistic term for dimension is character. In this figure for each of the five characters there are two possible character states, prime and not prime. Taxa 1-4 are shown in Figure 1 with their character state definitions in parentheses.
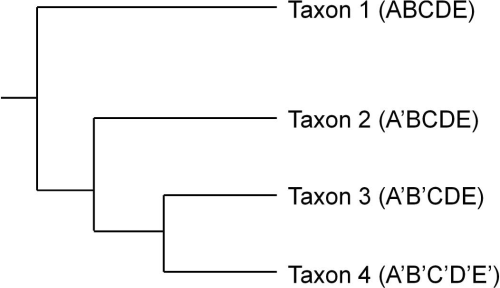
Figure 1. Phylogenetic tree showing relationships between taxa based on the distribution of shared derived character states.
In Figure 1 non-prime character states are ancestral and prime character states represent evolved novelties. Each bifurcation in the tree represents a character state change found in all the taxa to the right of that bifurcation or node. The split between Taxon 1 and Taxa 2-4 is defined by a change in character states from A to A’. Similarly the bifurcation separating Taxon 2 from Taxa 3 and 4 is defined by the change from character state B to B’. In this phylogenetic tree Taxon 3 is considered more closely related to Taxon 4 than it is to Taxon 2.
The notion of a character state’s ancestral or derived nature is relative (O’Brien and Lyman 2003:59-62). The common ancestor of Taxa 3 and 4 exhibited character states A’ and B’ while the common ancestor of Taxa 2, 3, and 4 also exhibited character state A’. When comparing only Taxa 3 and 4, character state A’ is ancestral as this character does not differentiate Taxa 3 and 4 from Taxon 2. However, when comparing Taxa 2-4, character state A’ is derived as this character state now differentiates those taxa from Taxon 1.
In the generation of phylogenetic trees a common cladistic technique (parsimony) attempts to group taxa in a series of bifurcating relationships such that the number of character state changes in a tree required to account for all the taxa is minimized (O’Brien and Lyman 2003:63). The number of character state changes in Figure 1 is five and this is considered the tree length. One character state change for the ancestor of Taxa 2-4, one for the ancestor of Taxa 3 and 4, and there are three character state changes that occur only in Taxon 4. We can create an alternate hypothesis regarding the phylogenetic relationships among these taxa by switching the positions of Taxa 2 and 3. This tree, however, contains six character state changes. An additional character state change is required for Taxon 3 now (B to B’) giving this tree a length of six. Using the rule of parsimony, the best tree is the one with the shortest length as it includes the fewest bifurcations or evolutionary events to account for taxa similarities. Thus the first tree (Figure 1) is considered the better hypothesis.
Given the simple set of data in Figure 1 it is also easy to determine how these taxa would be grouped based on phenetic similarity where there is no differentiation between ancestral and derived homology (see O’Brien and Lyman 2003:75-81). In Figure 1, Taxon 3 is more closely related to Taxon 4 than to Taxon 2 based on shared derived characters, in this case, character state B’ shared by Taxa 3 and 4. However if we group the taxa in Figure 1 based solely on phenetic similarity, Taxon 3 shows a closer affinity to Taxon 2 (four shared character states) and Taxon 1 (three shared character states), than it does to Taxon 4 (two shared character states). Unlike measures of phenetic similarity, however, cladistics produces arrangements of taxa that rely solely on the distribution of shared derived characters.
Figure 1 displays an additional important quality of cladistically derived trees. Phylogenetic trees group taxa into clades at various hierarchical levels (O’Brien and Lyman 2003:44-46). A clade (also termed a monophyletic group) includes all of the taxa that are related through a single common ancestor, that is they are all related through transmission. In Figure 1, Taxa 3 and 4 form a clade as do Taxa 2-4. In contrast, Taxa 1, 3, and 4 do not form a clade as all the taxa related to the common ancestor of Taxa 1, 3 and 4 and are not included in the group. Taxa 1, 3, and 4 form what is called a paraphyletic group. In cladistics, paraphyletic groups are not useful for constructing parsimonious hypotheses of transmission-generated relatedness. If we are using our phylogenetic tree in Figure 1 and we hypothesize that Taxa 1, 3, and 4 are more closely related to each other than they are to Taxon 2, we need to justify why Taxon 2 is not also included as it shares a common ancestor with Taxa 1, 3, and 4. By using paraphyletic groups within phylogenetic trees we are circumventing the arrangement created by the tree and thus one of the primary reasons for using cladistics. In short, the use of paraphyletic groups to demonstrate relatedness requires us to craft additional arguments not based on the distribution of character states in the tree and thus questions our original application of the method to the problem of relatedness.
We can craft hypotheses of relatedness based on heritable continuity using the clades produced through cladistic analysis and we can also track particular routes or lineages of transmission within a phylogenetic tree (O’Brien and Lyman 2003:121). The lines of descent in a phylogenetic tree from the base of the tree, through various nodes (i.e., hypothetical ancestors) to the terminal taxa are transmission lineages (Figure 2).
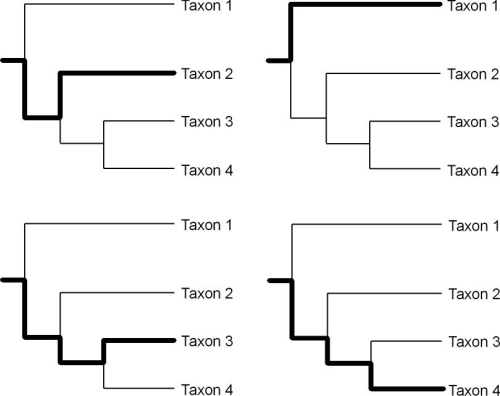
Figure 2. Four transmission lineages (bold lines) within the Figure 1 phylogenetic tree. See O’Brien and Lyman (2003:Figure 4.7)
Clades and transmission lineages exhibit a somewhat counterintuitive relationship to each other. Clades are groups of hierarchically related taxa. The terminal taxa of a clade are related through a series of common hypothetical ancestor at various levels in the hierarchy represented by the nodes of the tree. These terminal taxa also define transmission lineages and the application of these taxa (i.e., homologous classes) to the empirical world creates temporal and spatial distributions that hypothetically map the temporal and spatial characteristics of a transmission lineage. The transmission lineages defined by the terminal taxa of a clade are then also related hierarchically. For example, in Figure 2 the lineages defined by taxa 3 and 4 share a more exclusive relationship than those lineages together share with the lineage defined by taxon 2.
The Mechanics of Creating Phylogenetic Trees
The phylogenetic tree in Figure 1 is a simplified example that we would never find in an analysis of real data. In Figure 1 no character states revert to an ancestral state, and similar character state changes do not occur across separate lineages. With real world data, however, these events often transpire. In the cultural realm we might expect character states to sometimes revert to ancestral states (e.g., reinvention), and similar sequences of character state change may occur in separate lineages. When this happens it is difficult for cladistic techniques to produce trees consisting only of bifurcating splits.
When similar sequences of character states occur in separate lineages a scenario such as depicted in Figure 3 may be produced. The phylogenetic trees in (a) and (b) are the most parsimonious arrangements for these taxa and each are of length 6. Black boxes indicate character state changes with the new character state beneath the box. Taxon 2 is different from the previous tree (Figure 2) as it now exhibits the character state E’, similar to Taxon 4. With this new definition of Taxon 2, each of the most parsimonious arrangements contains an instance of convergence or parallelism (O’Brien and Lyman 2003:63) where the same character state change appears in separate transmission lineages; in (a) the character state is E’, and in (b) it is B’.
Without making assumptions about the cost of particular character state transformations (see Kitching 1992b, Scotland 1992), cladistic techniques can not decide upon a better hypothesis of phylogenetic change given the two trees in Figure 3 (a) and (b). One solution is shown in Figure 3 (c) with what is called a consensus tree. Since we can not unambiguously decide between the two trees, the consensus tree displays the relationships between taxa that are shown in both (a) and (b). Since in both (a) and (b) Taxa 2-4 form a clade, the consensus tree joins all three taxa in a single undifferentiated group. There are several techniques for constructing consensus trees (Figure 3 shows a strict consensus tree) (see O’Brien and Lyman 2003:68-72).
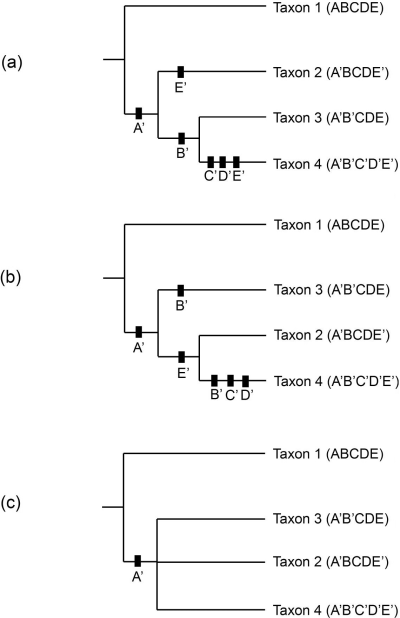
Figure 3. Two possible cladistic trees (a, b) for Taxa 1-4, each of length 6, and the consensus tree (c) showing the homoplasious relationship of Taxa 2-4.
The parallelism or convergence depicted in Figure 3 along with character state reversals are generally referred to as homoplasy (see O’Brien and Lyman 2003:62-63). This condition hinders our ability to construct phylogenetic trees consisting of only bifurcations for a given set of taxa. With real world data, however, phylogenetic orders often have multiple instances of homoplasy across numerous (thousands and hundreds of thousands) equally parsimonious trees.
As we add taxa, characters, and come across instances of homoplasy the chore of constructing the most parsimonious tree or consensus tree is beyond our computational capabilities. There are many cladistics programs to choose from that will produce phylogenetic trees and perform other operations on a series of taxa and character state definitions. The program PAUP* 4.0 (beta version 10) by Swofford (2001) is used by many.
Cladistics software takes care of the computational work of creating parsimonious trees given a set of data and there are several algorithms that can be followed to create trees. The method of Maximum Parsimony has been described here. Prior to the computational work, however, the analyst must construct a classification that describes phenomena by homologous character states (O’Brien et al. 2002, Scotland 1992) and determine for the taxa under consideration which character states are ancestral and which are derived. This is referred to as determining character polarity and is accomplished through the choice of an outgroup.
An outgroup is a taxon that diverged from all the taxa in a phylogenetic tree before they diverged from themselves. Thus an outgroup determines which character states are ancestral and which are derived. Different outgroups, of course, will produce different phylogenetic trees given the same set of taxa, thus the choice of outgroup greatly influences the resulting analysis.
There are different methods for determining an outgroup (Kitching 1992a, O’Brien and Lyman 2003:59-62, 159-164), but in general one should choose an outgroup taxon that is closely enough related to the taxa being ordered (the ingroup taxa), so that the ancestral and derived nature of character states is correctly determined. Any group can serve as a possible outgroup, but we want to choose a group that is close enough to the ingroup taxa to serve as an informative guide to character polarity.
Debates in the Use of Cladistics to Track Material Culture Change
Phylogenetic trees create groups of sister-taxa related through a common ancestor. The notion that nodes in the phylogenetic tree represent ancestors is, however, problematic in the analysis of both biological (Ridley 1986:138-149) and cultural (O’Brien and Lyman 2003:81-83) change. Consider, for example, Figure 1 where Taxa 2-4 are related through a common ancestor. If these taxa (e.g., prehistoric pottery vessels classes) had appropriate dates of origin and extinction we could possibly say that Taxon 2 was the (cultural) ancestor of Taxa 3 and 4. Phylogenetic trees do not, however, distinguish between sister-taxa and ancestor-descendent taxa.
The solution to this problem is to consider the nodes of a phylogenetic tree to represent hypothetical ancestors or more appropriately as collections of ancestral character states from which later sets of character states (our terminal taxa) emerged. Thus in Figure 1, Taxon 2 might be the ancestor of Taxa 3 and 4, but it also might be another descendant from the pool of ancestral character states represented by the node that joins these three taxa. One ramification of this position is that phylogenetic trees do not track the phylogenetic relationships of taxa per se, but rather they track the changing configurations of sets of character states. Only some of these sets of character states are represented by the terminal taxa in our phylogenetic trees (Ridley 1986:138-149). This position on ancestors also refutes arguments such as Moore’s (1994:928) that anthropological cladistic analyses intend to reconstruct “real antecedent populations [at the nodes of a cladogram], not representations created only for comparative purposes.”
A variety of arguments against applying phylogenetic and cladistic methods to cultural phenomena have been made over the years (see O’Brien and Lyman 2003:97-121), but here I briefly address only one here: role of phylogenetic trees in explanation.
Phylogenetic trees are not explanations regarding the transmission relationships among a set of taxa. A phylogenetic tree is one possible hypothesis of these relationships. Different phylogenetic trees can be generated from the same set of taxa and each of these hypotheses can be evaluated by means internal to the cladistic method (e.g., various tree statistics such as length and tree construction algorithms) and through external data such as the chronological and spatial relationships of taxa.
A phylogenetic tree presents a set of relationships that must be explained (O’Brien and Lyman 2003:111-113). The configurational aspects of a human group and the natural and cultural environment, along with properties of cultural transmission, selection and sorting mechanisms, and innovation may explain the pattern presented by a phylogenetic tree. Conflating the pattern of a phylogeny with the processes that explain it is systematic empiricism, where observation and explanation become one and the same (Cochrane 2001, Willer and Willer 1973).
Bibliography
Cochrane, E. E. 2001. “Style, Function, and Systematic Empiricism: The Conflation of Process and Pattern,” in Style and Function: Conceptual Issues in Evolutionary Archaeology. Edited by T. D. Hurt and G. F. M. Rakita, pp. 183-202. Westport, Conn.: Bergin and Garvey.
Forey, P. L., C. Humphries, J, I. J. Kitching, R. W. Scotland, D. J. Siebert, and D. M. Williams. Editors. 1992. Cladistics: a Practical Course in Systematics. Vol. 10. Oxford: Claredon Press.
Gray, R. D., and F. M. Jordan. 2000. Language Trees Support the Express-Train Sequence of Austronesian Expansion. Nature 405:1052-1055.
Hennig, W. 1950. Grundzüge einer Theorie der Phylogenetischen Systematik. Berlin: Deutscher Zentralverlag.
—. 1966. Phylogenetic Systematics. Urbana: University of Illinois Press.
Kitching, I. J. 1992a. “The Determination of Character Polarity,” in Cladistics: a Practical Course in Systematics, vol. 10, Systematics Association Publication. Edited by P. L. Forey, C. Humphries, J, I. J. Kitching, R. W. Scotland, D. J. Siebert, and D. M. Williams, pp. 22-43. Oxford: Claredon Press.
—. 1992b. “Tree-Building Techniques,” in Cladistics: a Practical Course in Systematics, vol. 10, Systematics Association Publication. Edited by P. L. Forey, C. Humphries, J, I. J. Kitching, R. W. Scotland, D. J. Siebert, and D. M. Williams, pp. 44-71. Oxford: Claredon Press.
Kitching, I. J., P. L. Forey, C. Humphries, J, and D. M. Williams. 1998. Cladistics: The Theory and Practice of Parsimony Analysis. Oxford: Oxford University Press.
Lipo, C. P., M. J. O’Brien, M. Collard, and S. Shennan. Editors. 2006. Mapping Our Ancestors: Phylogenetic Methods in Anthropology and Prehistory. New York: Aldine de Gruyter.
Mace, R., and M. Pagel. 1994. The Comparative Method in Anthropology. Current Anthropology 35:549-564.
Moore, J. H. 1994. Putting Anthropology Back Together Again: The Ethnogenetic Critique of Cladistic Theory. American Anthropologist 96:925-948.
O’Brien, M. J., J. Darwent, and R. L. Lyman. 2001. Cladistics is Useful for Reconstructing Archaeological Phylogenies: Palaeoindian Points from the Southeastern United States. Journal of Archaeological Science 28:1115-1136.
O’Brien, M. J., and R. L. Lyman. 2003. Cladistics and Archaeology. Salt Lake City: University of Utah Press.
O’Brien, M. J., R. L. Lyman, Y. Saab, E. Saab, J. Darwent, and D. S. Glover. 2002. Two Issues in Archaeological Phylogenetics: Taxon Construction and Outgroup Selection. Journal of Theoretical Biology 215:133-150.
Ridley, M. 1986. Evolution and Classification: the Reformation of Cladism. New York: Longman.
Scotland, R. W. 1992. “Character Coding,” in Cladistics: a Practical Course in Systematics, vol. 10, Systematics Association Publication. Edited by P. L. Forey, C. Humphries, J, I. J. Kitching, R. W. Scotland, D. J. Siebert, and D. M. Williams, pp. 14-21. Oxford: Claredon Press.
Sober, E. 1988. Reconstructing the Past: Parsimony, Evolution, and Inference. Cambridge, Massachusettes: MIT Press.
Swofford, D. L. 2001. “PAUP*: Phylogenetic Analysis Using Parsimony And Other Methods,” 4.0 edition. Sunderland, MA: Computer program distributed by Sinaur Assoicates.
Tehrani, J., and M. Collard. 2002. Investigating cultural evolution through biological phylogenetic analyses of Turkmen textiles. Journal of Anthropological Archaeology 21:443-463.
Willer, D., and J. Willer. 1973. Systematic Empiricism: Critique of a Pseudoscience. Englewood Cliffs, N.J.: Prentice-Hall.